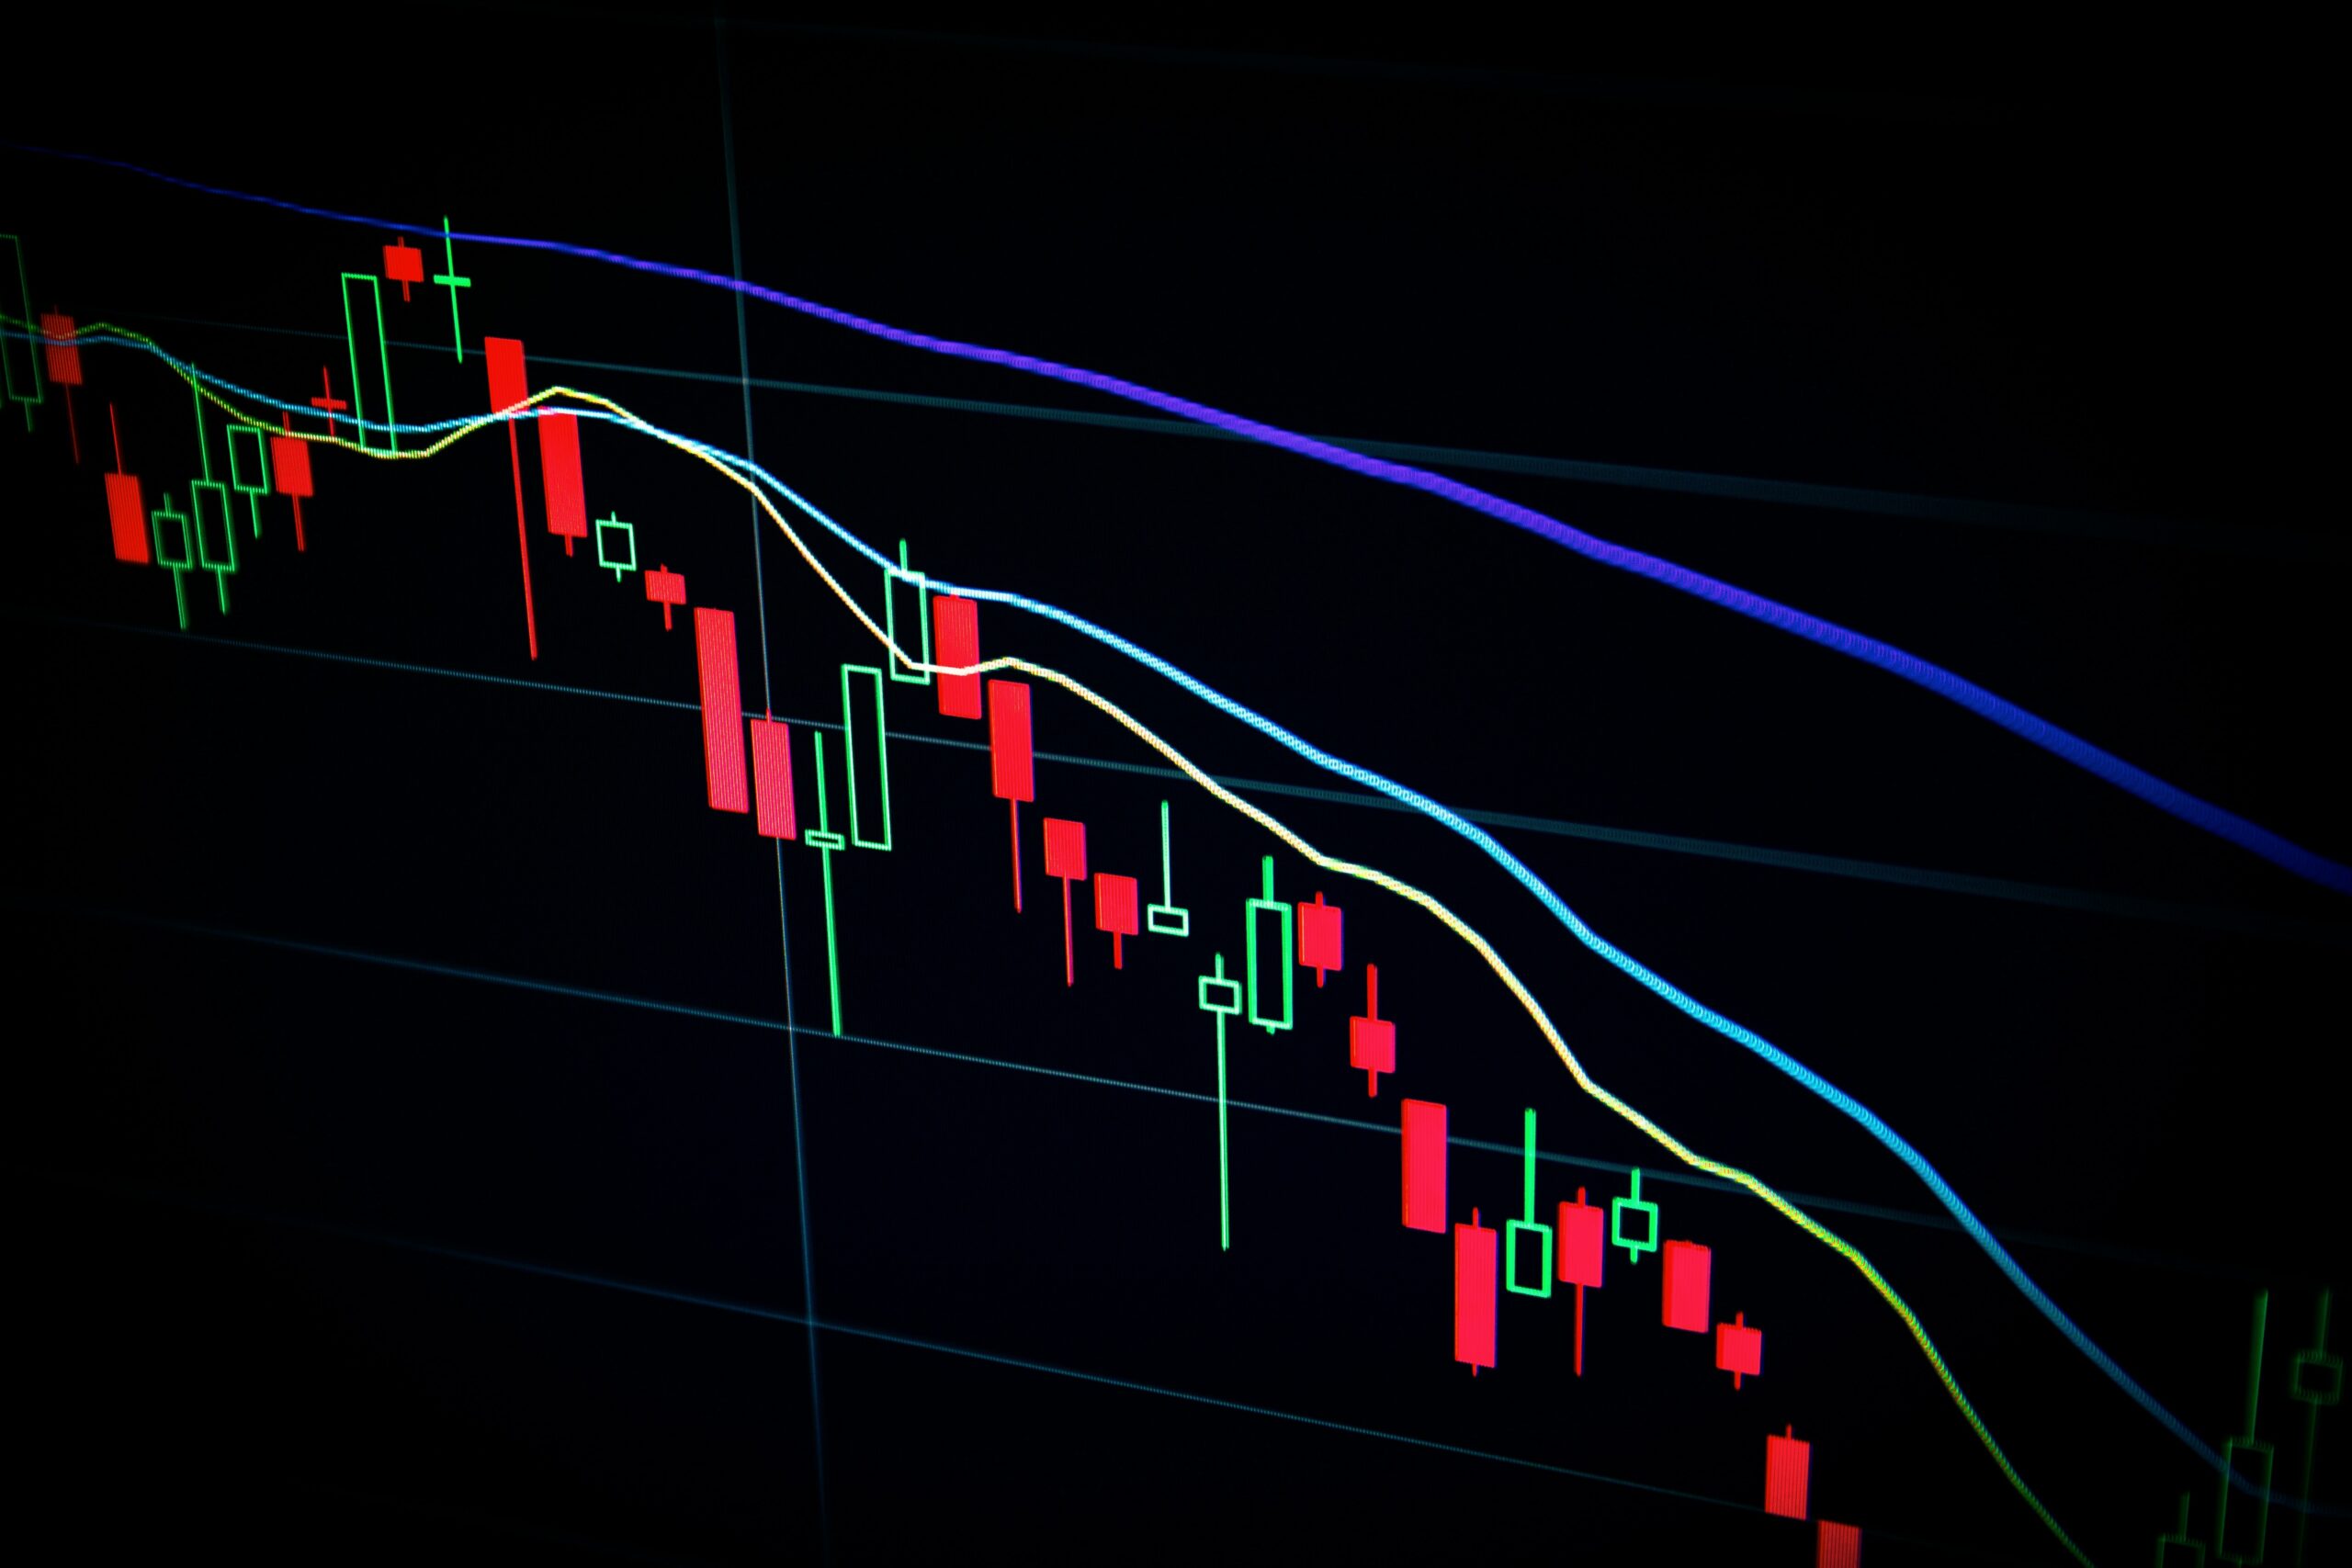
Sign of the week: The supply of long-term holders reached a new all-time high in absolute terms, collectively holding 16.44 million BTC, 82% of all BTC in circulation. Normally, LTH supply refreshes its all-time high in the middle of the bear market.
Bitcoin briefly fell below $70,000, falling out of the world’s 10 largest assets by market capitalization amid a new wave of risk aversion fueled by the conflict between the United States and Iran. Despite this, long-term holders continued to accumulate BTC, following similar patterns from previous bear markets.
About the Bitcoin Impact Index
The Bitcoin Impact Index measures which groups of Bitcoin holders are under financial stress, how severe that stress is, and whether it is severe enough to shake confidence in the direction of the market. It combines on-chain holder behavior, ETF and derivatives activity, and exchange-level liquidity flows into a single weekly score between 0 and 100. Unlike sentiment indicators, it deliberately excludes social media and volume data to focus on what participants do rather than what they say.
Scoring bands:
- Normal rotation (0–24) — routine profit taking, without structural change
- Elevated repositioning (25–49) — specific groups changing position, uneven pressure across the market
- High impact (50–74) — widespread tension between multiple groups of holders and institutional flows simultaneously
- Critical Hit (75–100) — total capitulation: LTH losses, large ETF outflows, major liquidations and strong currency inflows at the same time
Week 22 (May 25 to 31): BII-W 54.6: high impact
Positive signs: long-term holders continue to absorb selling pressure
Long-term holders added around 76,000 BTC this week, bringing their total holdings to a new all-time high of 16.44 million BTC. This cohort now controls 82% of all Bitcoin in circulation.
In previous bear markets (2014, 2018, 2022), the supply of long-term holders typically reached a new all-time high in the middle of the bear market, and this cohort continued to actively accumulate closer to the end of the bear market. The current reading is consistent with that mid-cycle accumulation phase, suggesting that the bear market could be far from over.
As such, LTHs act as the main force absorbing selling pressure at the moment, but their pace of accumulation has been slowing recently. If LTHs move from accumulation to distribution soon, this could be seen as a double-edged sword:
- On the one hand, it may indicate increasing demand from short-term holders, which usually occurs at the beginning of major Bitcoin rallies.
- However, if this occurs while the market is bearish, this could accelerate the bearish momentum. A notable example is November 2025, when the price of Bitcoin fell almost 18% in one month.
For now, accumulation is still present and occasionally accelerates during price declines, which is a positive development in terms of absorbing selling pressure.
Negative signs: three consecutive weeks of ETF outflows of more than $1 billion
ETF outflows reached $1.42 billion this week, marking the third consecutive week above $1 billion in outflows. This is the second largest set of outflows in three weeks in the history of Bitcoin spot ETFs. If this streak continues, it could suggest broader capitulation by ETF investors, which may reinforce bearish momentum.
The stress of short-term holders deepened further. Its realized P/L fell below –0.77, the worst reading since the February sell-off. As a result, recent buyers are facing significant losses and the pressure to sell is high. LTH SOPR also fell to 0.83, meaning that even long-term holders who are selling are doing so at deeper losses, although most are still holding rather than distributing.
Long-term settlements accounted for 88% of the total this week, the most one-sided reading since late January. Leveraged bulls are being systematically pushed out, stablecoin flows remain negative, and realized loss density rose to its highest level in two months, all indicating that bears are gaining more solid footing.
Mixed signals: Funding rates turned positive, but not for bullish reasons
Funding rates turned slightly positive this week, but this should not be interpreted as a positive sign in isolation. This could suggest that the remaining long positions are paying to remain open while being squeezed out one by one, rather than generating genuine bullish conviction.
Net exchange flow remains positive, meaning more BTC is arriving on exchanges than leaving. That’s a sell-side signal: holders are moving coins to where they can be sold. The move is not dramatic compared to the February peak, but it is concerning in directional terms.
What could happen next?
Bitcoin fell below the 128-day moving average and the weekly Bollinger Band midline, opening the way to $70,000 or lower. The next major support level lies near $66,000.
In the short term, lower time frame signals suggest that a brief bounce towards $74,000 is possible, but the path of least resistance remains down. For that to change, the bulls need to recapture $78,000, where both the true average price and the cost basis for the short-term holder lie. Holding above that level would bring the most recent buyers back to breakeven and remove the selling pressure their losses currently create.
The long-term outlook depends on what long-term holders do next. If LTH supply continues to increase, we may see a classic bear market like in 2018 and 2022. If LTH supply begins to decline rapidly, that would signal the end of the bear market or a potential bottom could be delayed even further by 3 to 6 months.
The web content provided by CEX.IO is for educational purposes only. The information and tools provided are not and should not be construed as an offer, a solicitation of an offer or a recommendation to buy, sell or hold any digital asset or to open a particular account or engage in a specific investment strategy. Digital asset markets are very volatile and can lead to loss of funds.
The availability of products, features and services on the CEX.IO platform is subject to jurisdictional limitations. To understand what products and services are available in your region, please see our list of supported countries and territories. This page includes additional links to information about individual products and their accessibility.